In a week when opinion polls were shown not to have done very well in the US, research into why the polls got it wrong in the 2019 Australian election was published – basically, it was the human factor.
Polling was easier in the days when nearly all households had a landline and people got their news and information from TV, radio and newspapers which at least aimed to deliver true information.
Enter mobile phones and the internet combined with armies of scamsters and shysters misusing them for their own ends and accurate polling becomes well-nigh impossible.
Many only answer to identified people in their contacts list. Many hang up when called by pollsters. More people have become anti-social, less engaged, less trusting and even frightened of giving any information to anyone.
Their political views are simply not sampled by the pollsters, but do show up at voting time. Small wonder the two often do not match.
This week’s research into the 2019 polling was commissioned by the Association of Market and Social Research Organisations and the Statistical Society of Australia. It concluded that the polls were “likely to have been skewed towards the more politically engaged and better educated voters with this bias not corrected”.
The more politically engaged and better educated were more likely to vote Labor, the report said.
That, of course, is the reverse of the position in the 1950s and 1960s when the better educated voted for the Coalition.
The report dismissed the idea of a late swing to the Coalition after the last polling had been done or that the polls just out by the margin of error.
The Coalition won the 2019 election with 51.5% of the two-party-preferred vote compared to Labor’s 48.5%, “almost the mirror opposite of what the final polls found; all missing the result in the same direction and by a similar margin”.
So, the problem was in getting a good sample, not in the statistical science of polling.
The fact they all made around the same size error all in the same direction is somewhat comforting, however, because it is better than a situation where the polls were all over the place.
It means that, if the sampling error can somehow be corrected, they will get it right.
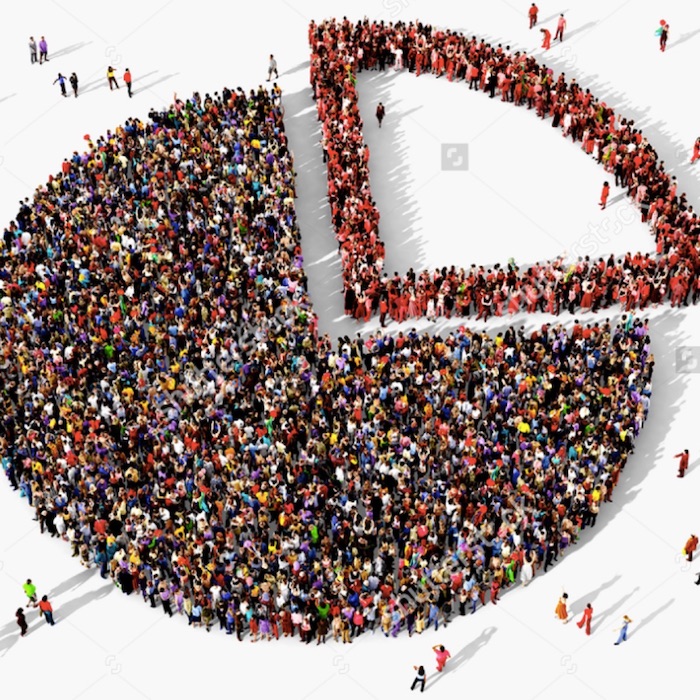
If, for example, the pollsters were sampling blue and red coloured balls and randomly selecting a sample of 1000 out of 10 million (5,150,000 blue and 4,850,000 red), they would get it right around 95 per cent of the time. If you then averaged all the polls you would get a pretty good idea of the complexion of the whole barrel of balls.
If, however, a significant number of those blue balls had some sort of repellent that made them less likely to be selected, the poll would be wrong. And that is what we have got in the human world.
The critical thing here is that the pollsters are all making the same error and they can all take steps to correct it.
Usually, pollsters verify their sample by asking for age group and gender. If these are the same or very nearly the same as the accurate census data, pollsters become confident their sample is good.
And if it is not good, they can have a go at correcting it. For example, if a sample has 10 percent too few people in, say, the over-65 age group, it can be corrected by weighting the answers given by people in that age group by 10 percent extra.
The trouble arises, though, when the less educated and less politically alert Coalition voters who refuse to be polled (which is their right) likely have the same age and gender profile as the population at large. The result is that the sampling error simply does not show up and cannot be corrected.
Worse, it is going to be near impossible to find a couple of simple questions to ask that can identify the percentage in the sample of the less-educated, less-informed and less politically engaged people and match it against census data, so any deficit in the sample can be corrected.
The census reports educational level but not how well-informed someone might be despite lower education nor their level of political engagement.
There is a Catch 22 here. How can pollsters find out the level of political disconnectedness and altertness when the disconnected refuse to answer their questions? Even if pollsters can get an accurate percentage of “refused-to-answer”, how can they work out which party they might be supporting.
Perhaps the pollsters could get together and devise a way to include these disconnected people. Would they respond to payment, however small. Or perhaps to go into a draw for a cash prize with attendant publicity about people winning a lot of money just for answering an opinion poll.
Alas, there are too many postcodes (3280 of them) for pollsters to use them and socio-economic census data on those postcodes to test their samples.
But another way might be to extrapolate from experience. The Brexit vote; the 2016 and 2020 US elections and the 2019 Australian experience suggest a sampling error against progressive candidates and positions of between 3 and 5 per cent. So perhaps pollsters should take between 1.5 and 2.5 percent off progressive candidates and give it to conservatives, authoritarians and the far-right.
US pollsters said they did this in the 2020 election, but it seems they did not make the allowance large enough.
Polling is important because it can show if a political party is heading in the wrong direction. Further, if questions about issues are asked, whether the party has got the popular mood on that issue. So, polls form an important democratic function between elections.
I hope that accurate polling does not become a permanent victim of our new alienated, self-obsessed world?
Crispin Hull
This article first appeared in The Canberra Times and other Australian media on 14 November 2020.